The Network State in One Image
Listen to this chapter

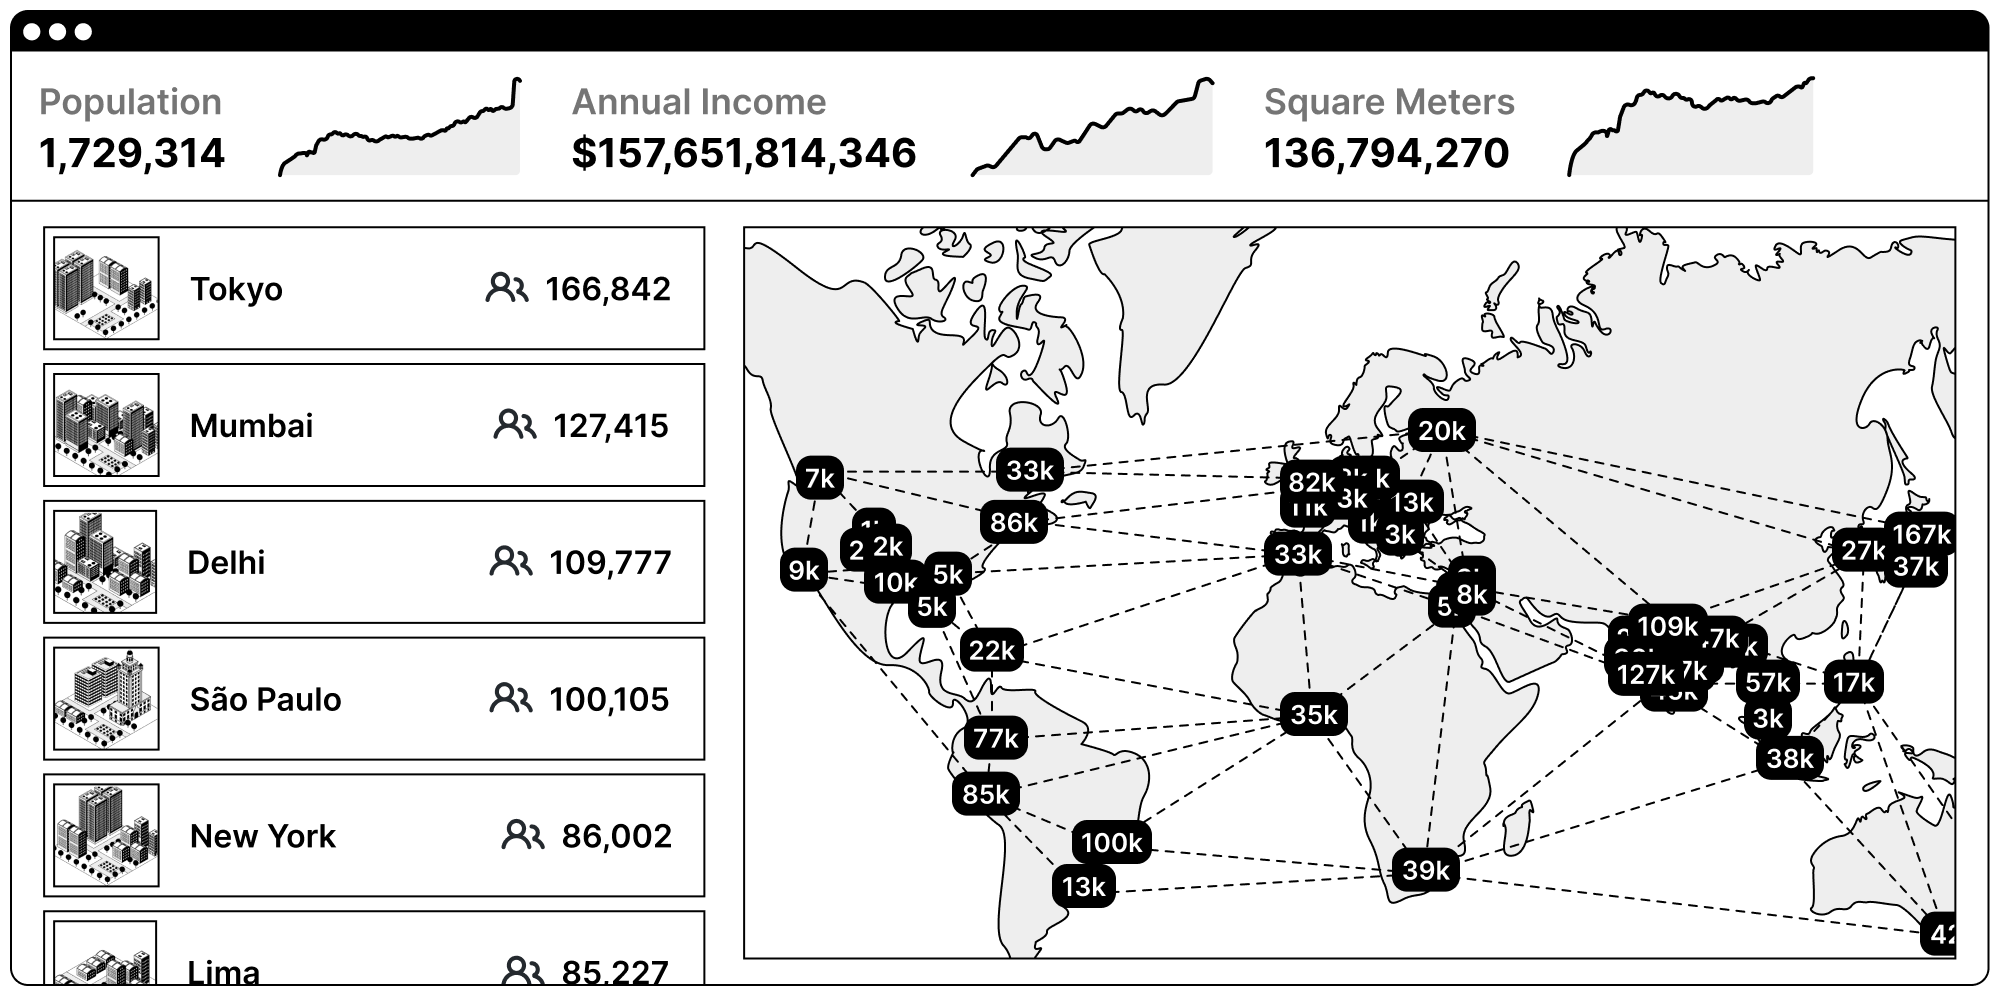
A network state isn’t an abstract thing. You can see it on a map. The dashboard above shows what one looks like. Specifically, it depicts a network state with 1.7 million people, more than 157 billion dollars in annual income, and a 136 million square meter footprint.
The first thing we notice is that a network state isn’t physically centralized like a nation state, nor limited in scale like a city state. It’s geographically decentralized and connected by the internet.
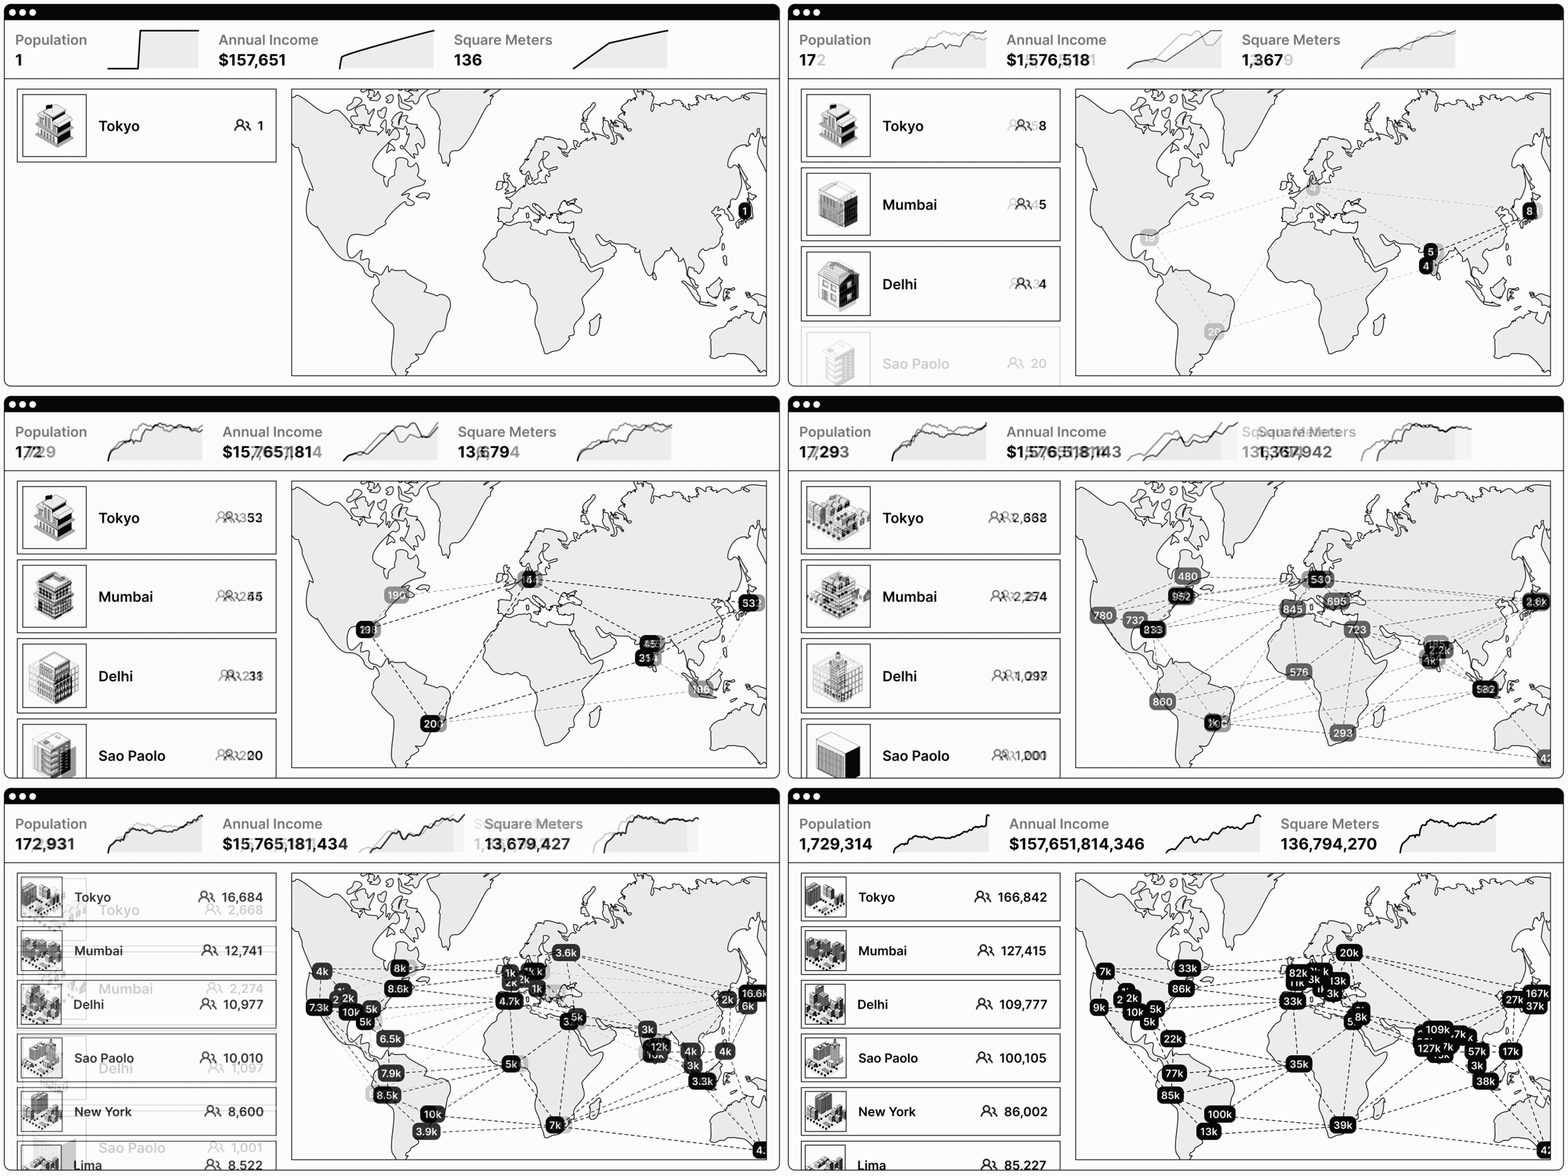
The second thing we see is that you could feasibly start this kind of country from your computer. That is, just as Facebook grew from one man’s laptop, a million-person network state that owns a global archipelago of physical territory could start as a single-founder startup society, as shown in this gif:

The third thing we observe is how central the real-time census is to the network state. The dashboard combines concepts from companies, currencies, and countries to focus a society on growth in people, annual income, and real estate footprint.
Continued growth is a continuous plebiscite, a vote of confidence by the people inside who remain and those outside who apply. Roughly speaking, a successful network state is one that attracts aligned immigrants, and an unsuccessful network state is one that loses them.
That doesn’t mean each network state must grow to infinity, or that all states need accept the same kind of person, but that the community of network states as a whole is focused on building admirable societies that people want to join. Different states will focus on different metrics; imagine a network state premised on improving its citizens’ overall life expectancy, or one aimed at provably right-shifting the income distribution for all. You get what you measure.
Next Section:
The Network State in One Sentence
